Now, we can use
Business Intelligence (BI)
to organize, analyze, report and publish that data into meaningful reports, dashboards and infographics.
Using Data to Drive Informed Decisions
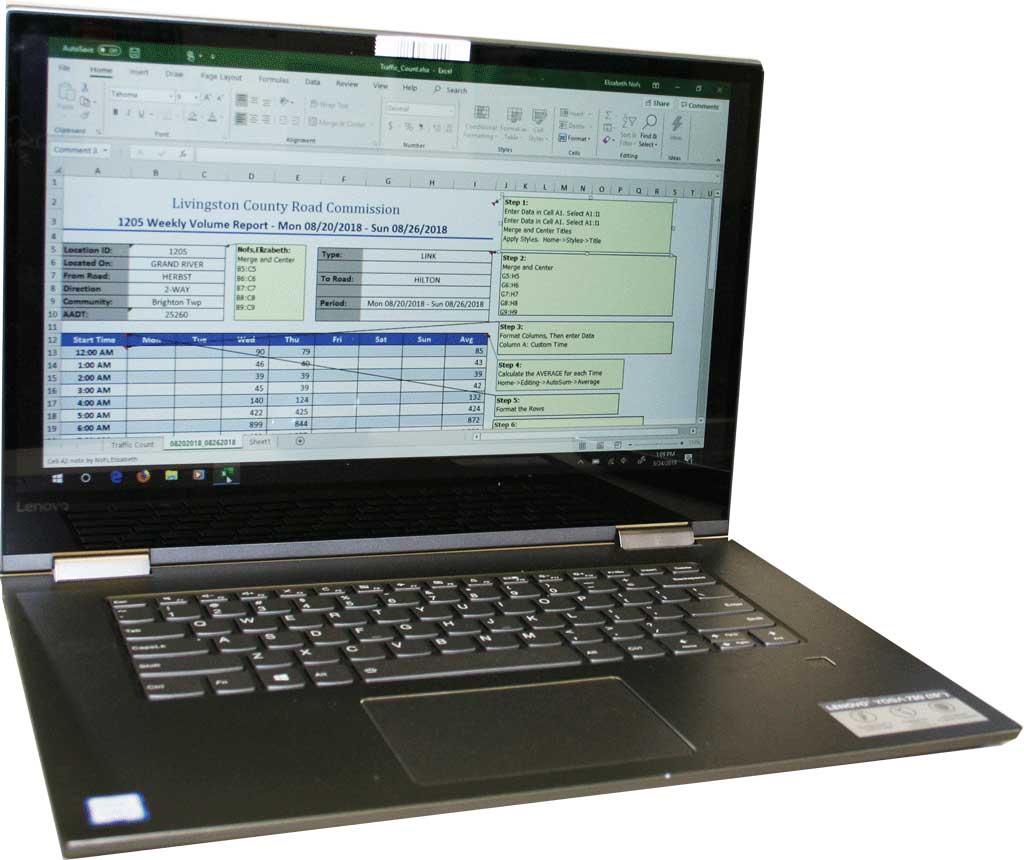
We have the tools to assign, gather, query, and present the data: Microsoft Access, Excel, Outlook, PowerPoint, Word, Smartsheet, and Power BI.
These programs are for you: if you are an office worker, manager, entrepreneur, or other professional who wants to start using advanced Microsoft Office skills immediately. This program is also suitable for you if you are looking to learn about this software and expand your job possibilities.
Examples of Our Work
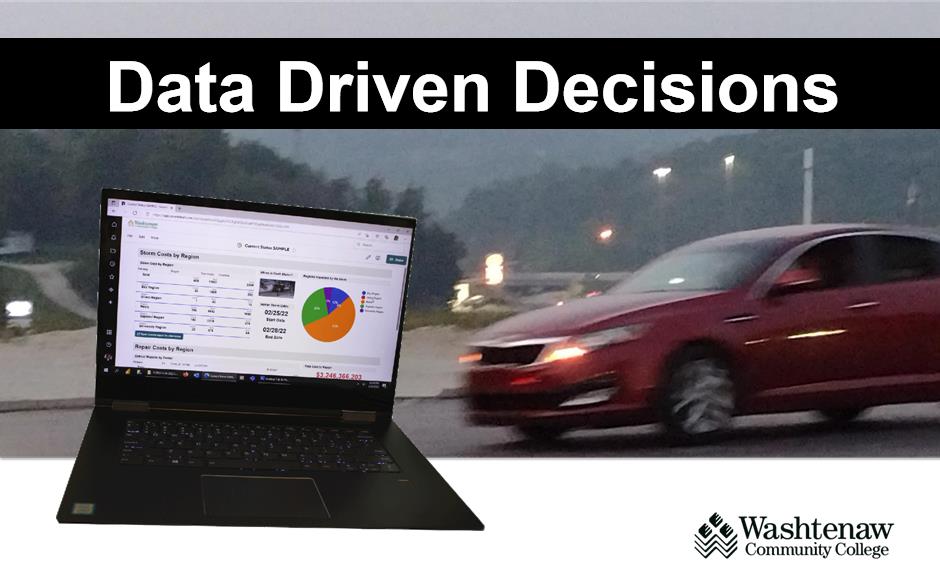
Data, Data, Data! A Dashboard is a live, interactive, view of the data. Dashboards are visual tools for users to see important information at a glance. Data dashboards can be linked to datasets and updated live.
We frame our project-based learning with real-world data like this (demo).
Like the Certification Samplers? Consider the courses. The demos are embedded into step-by-step written instructions to aide in high comprehension and retention. No videos droning on, but targeted demos within hands-on steps. All with real-world data in context.